My name is Jose Enrique Ortiz
I'm a passionate technologist and data thinker, developing skills for Data Analysis.

I'm a passionate technologist and data thinker, developing skills for Data Analysis.

During my training for Data Analytics, I worked on a Contact Prospects ETL Project. Its scope was to extract information from source systems & place in a staging table, source information from STG tables & perform column validation and load temp tables used in processing. Lookup dimension tables, transform the subject area data and generate insert files, check the quality of the data before loading it into the ODS, and then load the data into the ODS.

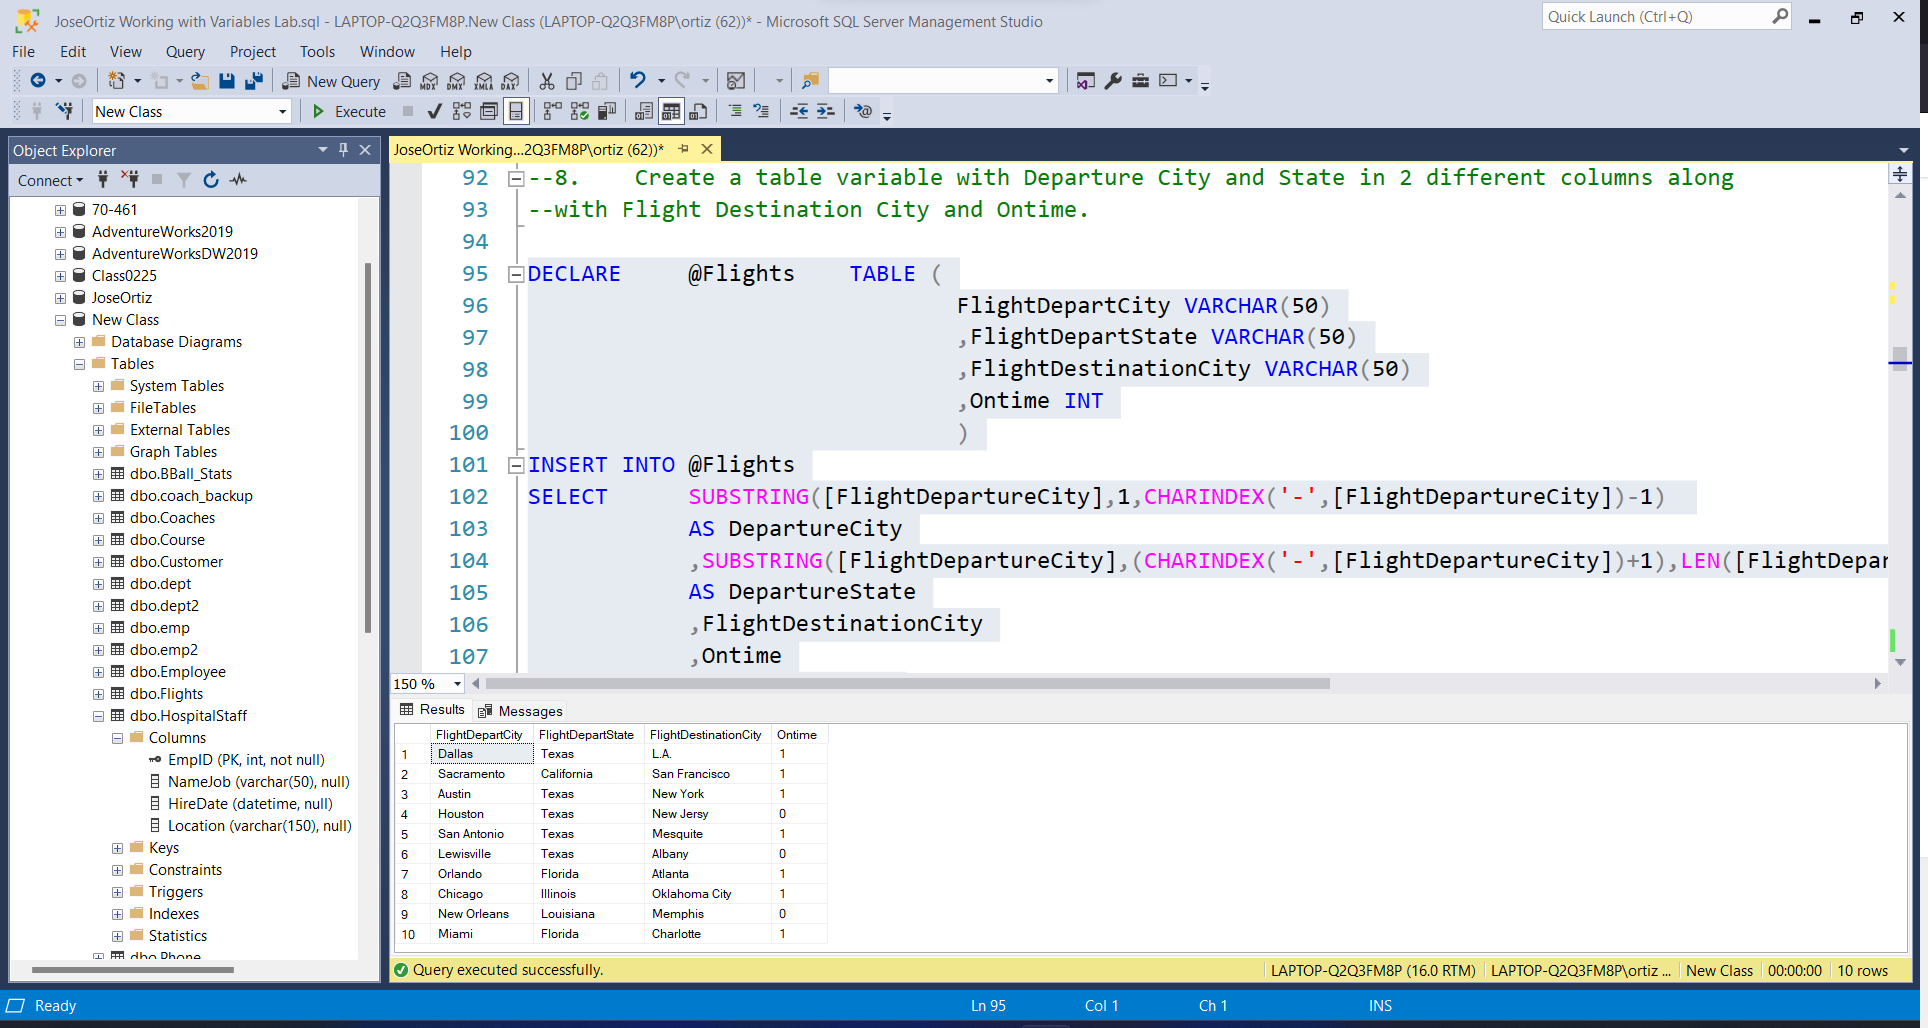
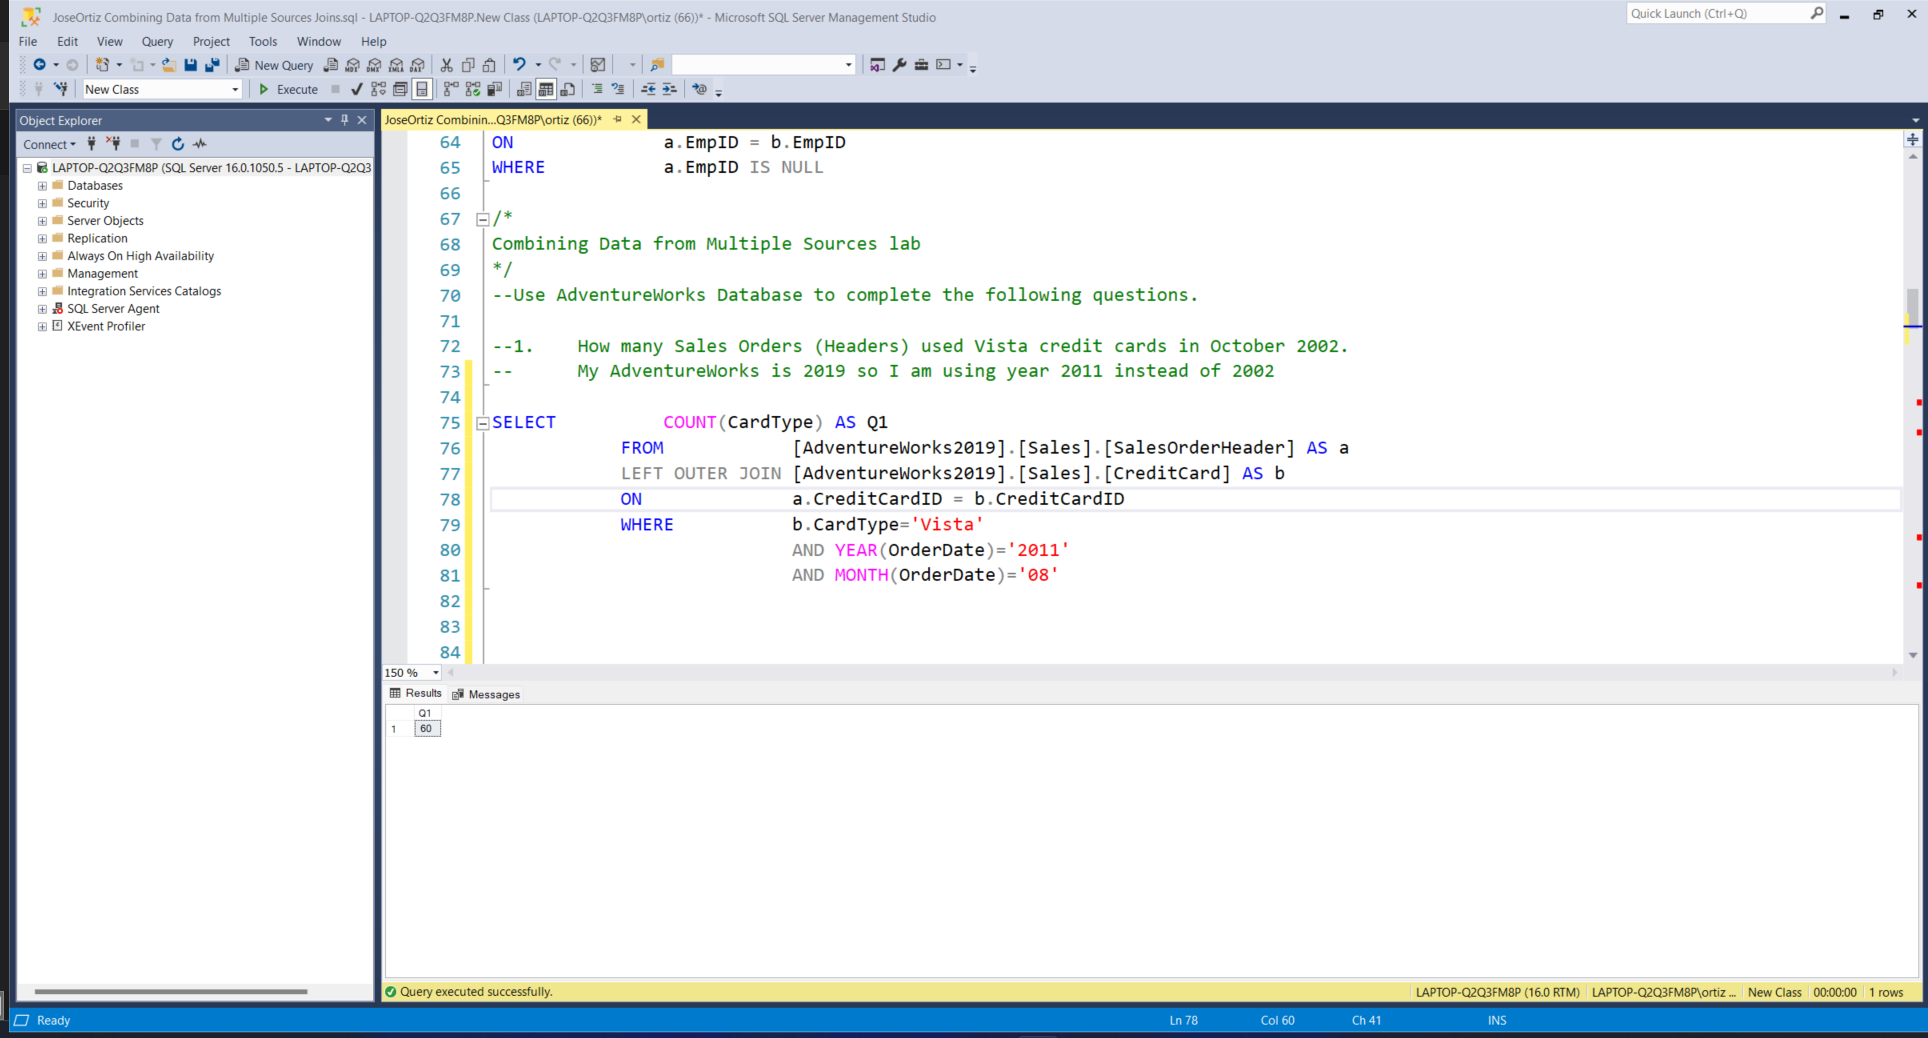
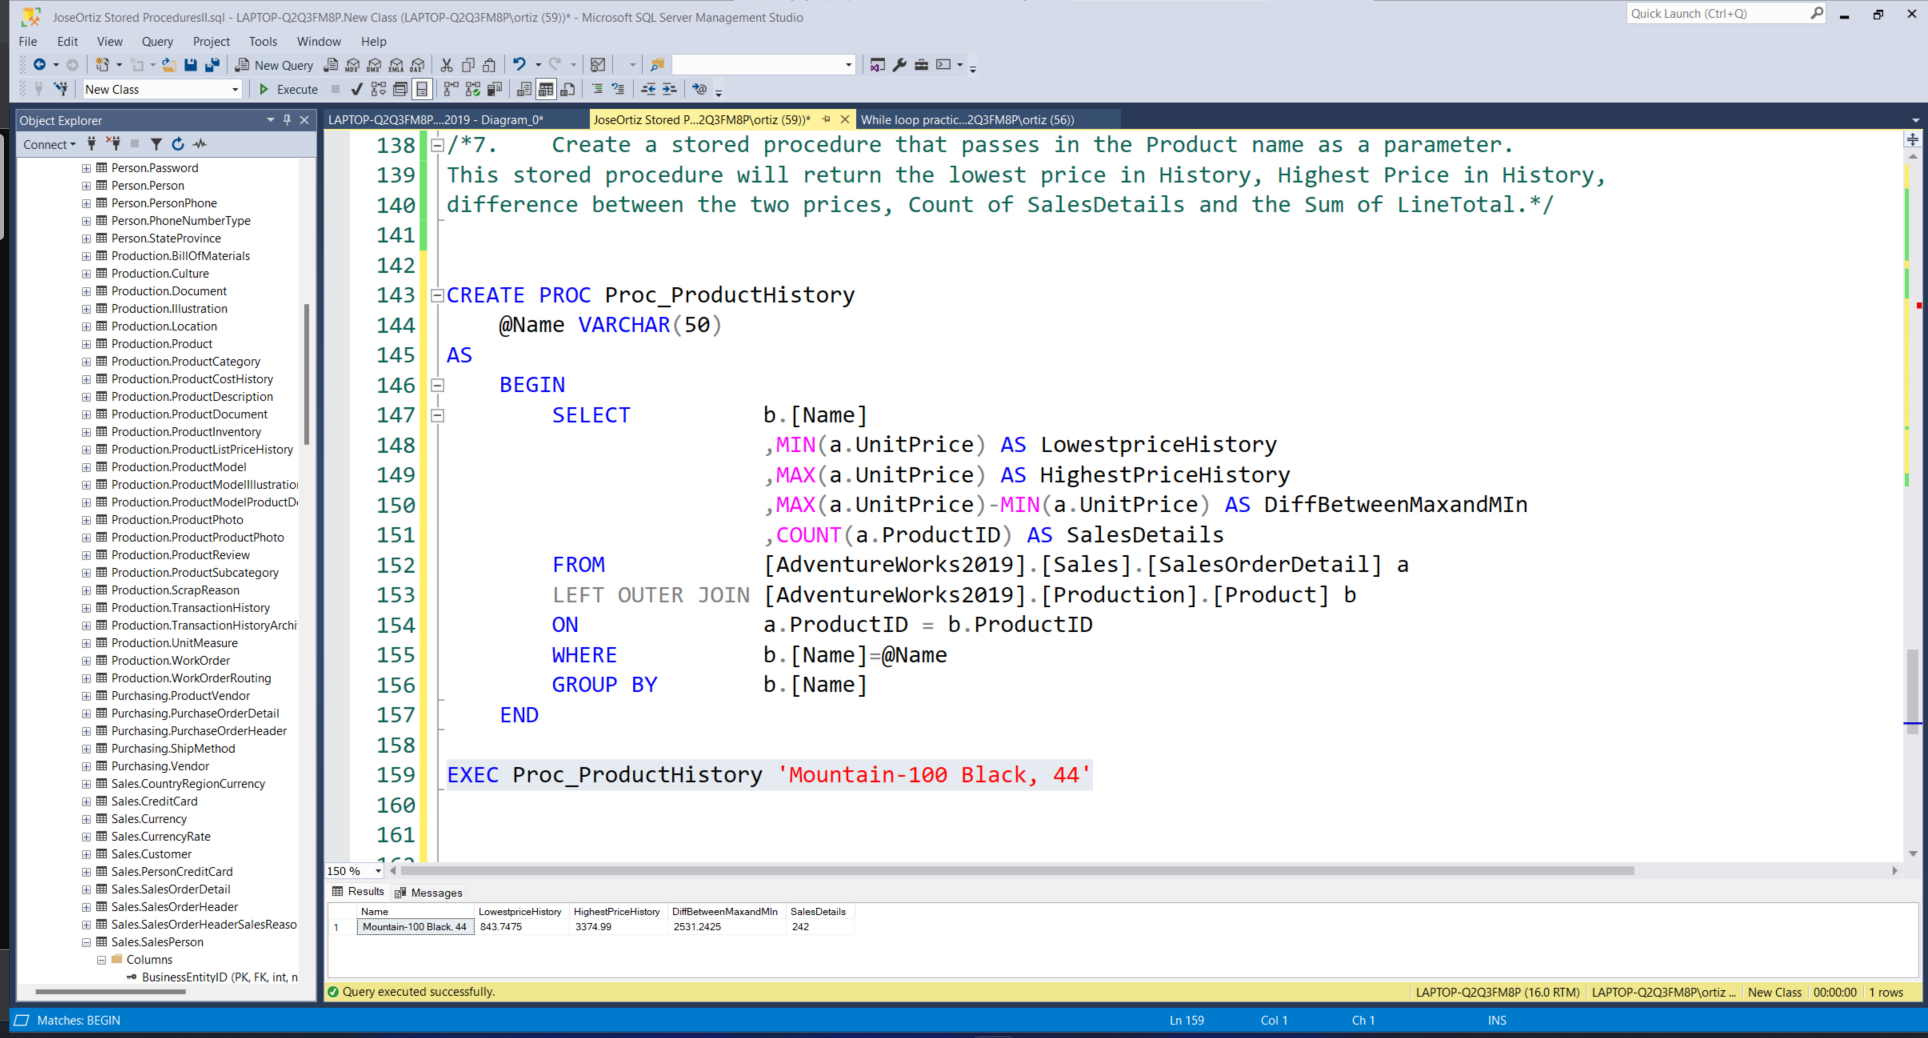
I reached an advanced level of sql coding skills thanks to an intensive and comprehensive curriculum. I completed several weekly laboratories and was able to cover the studies for grouping data, using constraints, limiting and sorting data, system and user defined functions, working with variables, combining data from multiple sources, developing and implementing stored procedures and managing views and triggers.

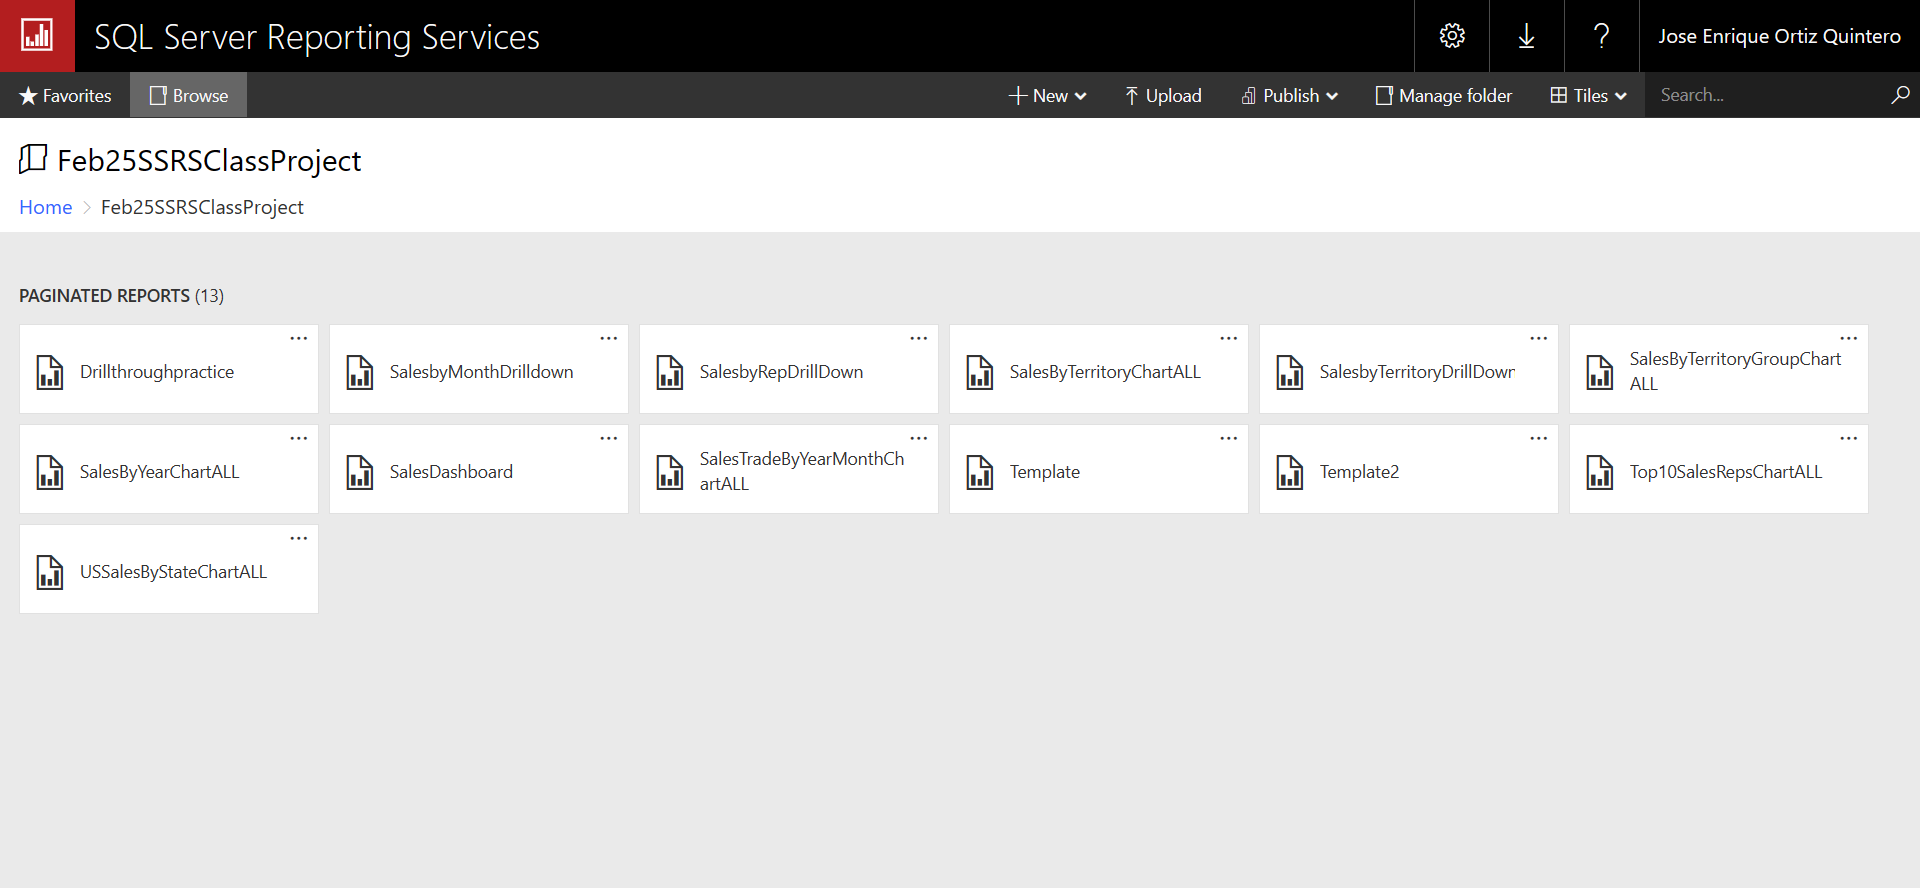
SSRS is Microsoft’s answer to business reporting. My project for this section of my training was to create a Sales Dashboard Overview. It tracks the activity based on year, territory, territory group, state sales and top 10 sales reps. The dashboard consisted of 6 sections all tied to sales throughout the company. This project gave me the opportunity to create charts and graphs, tables, matrices and drilldowns, work on parameterization, sub reports, drillthrough, report manager and report automation as well.
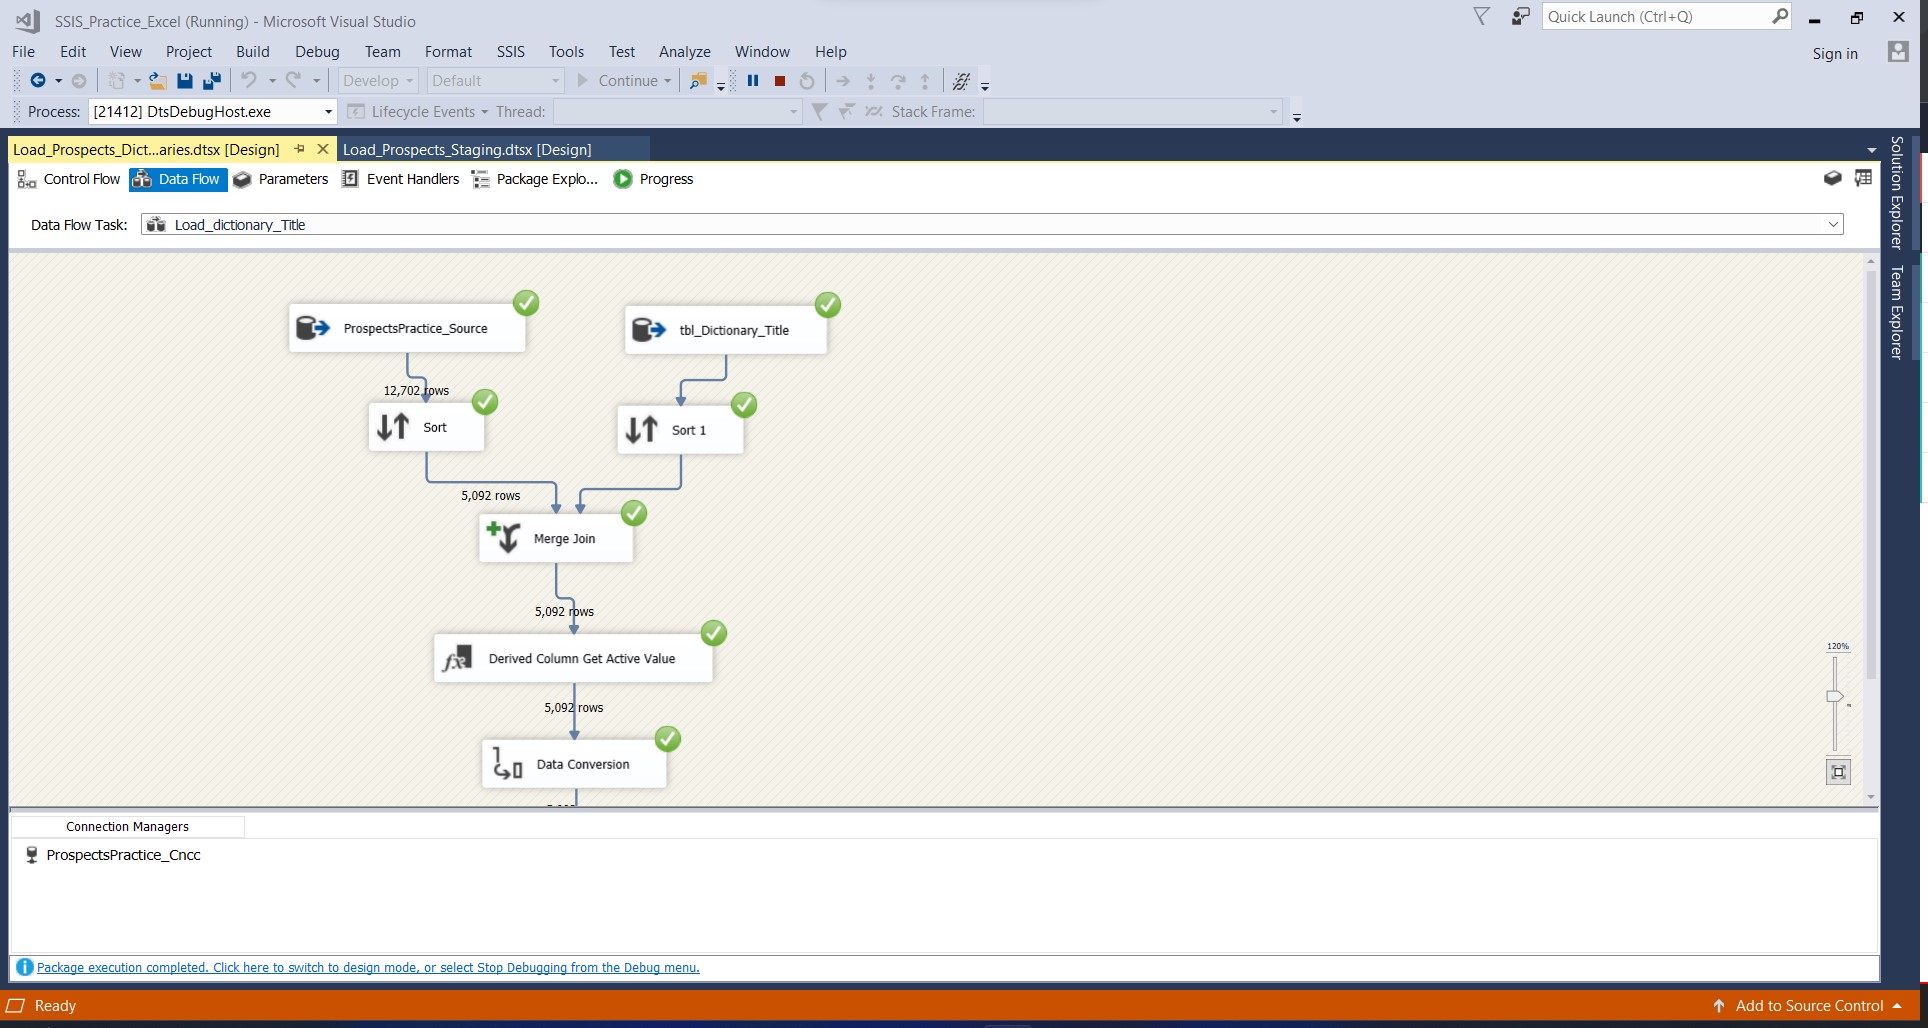
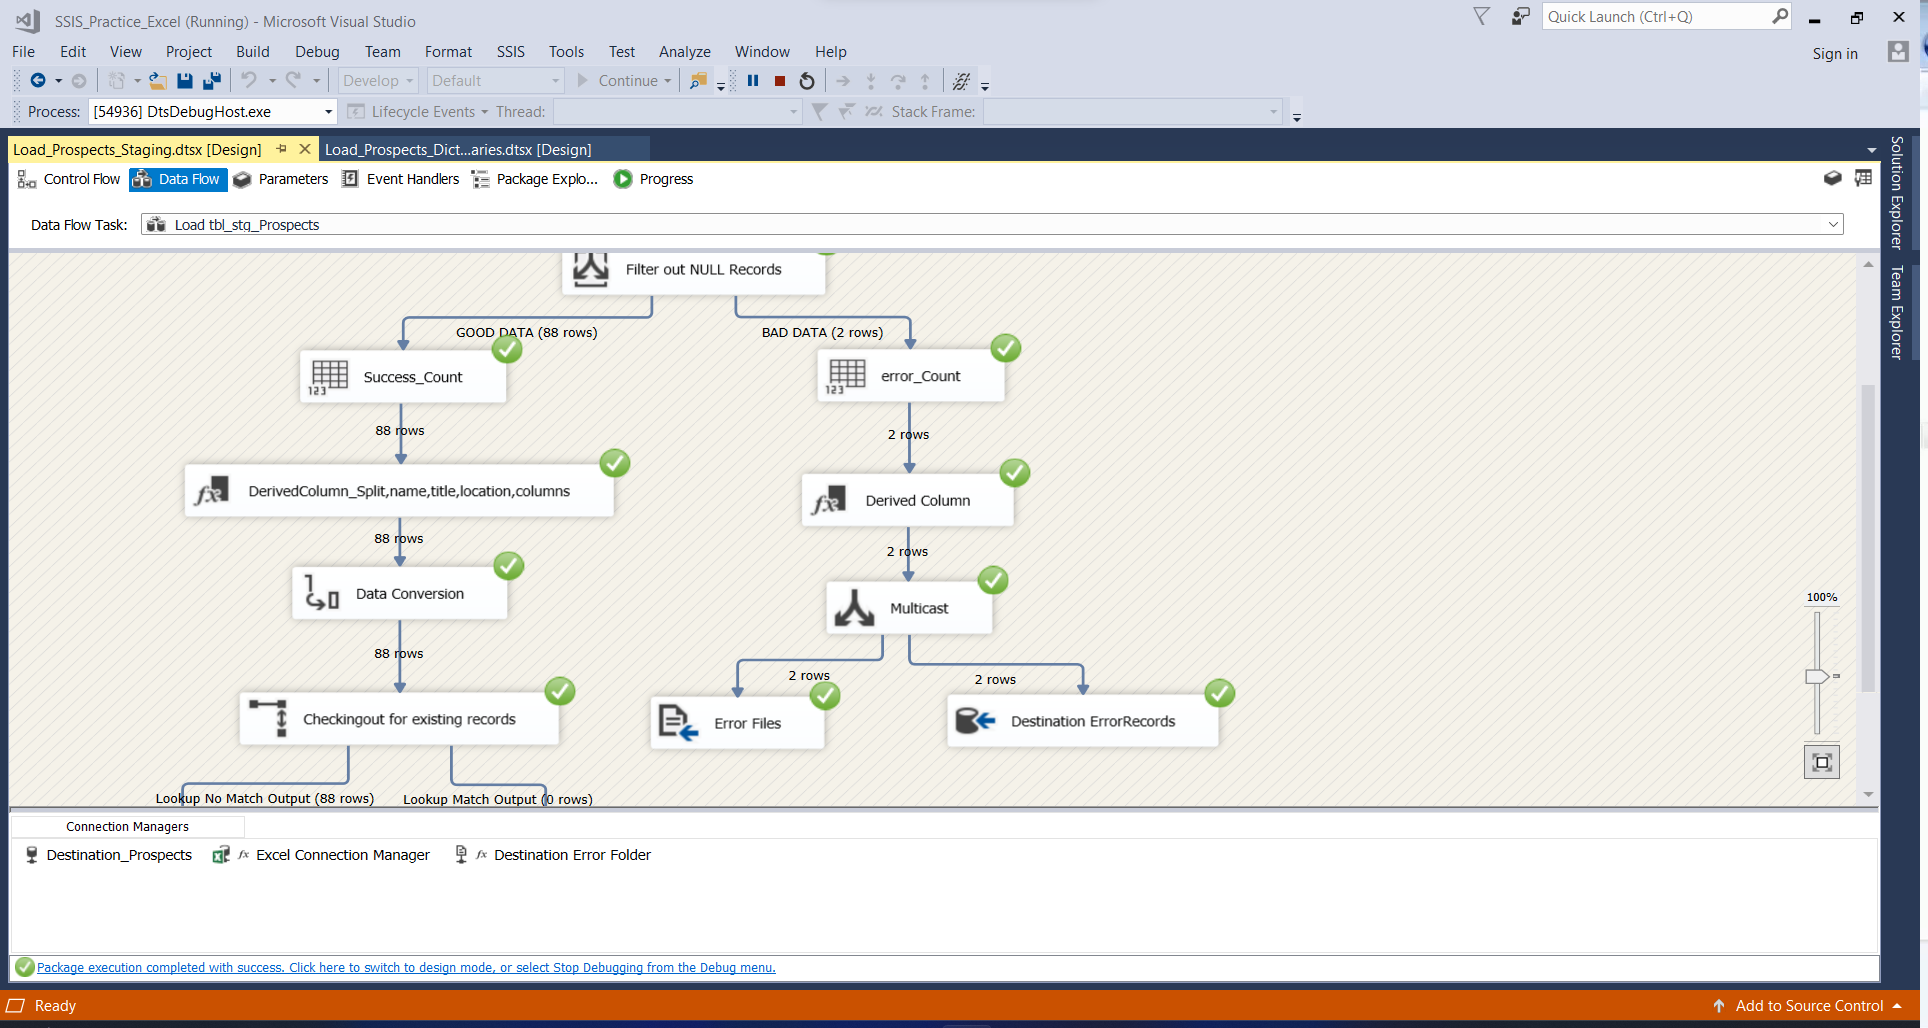
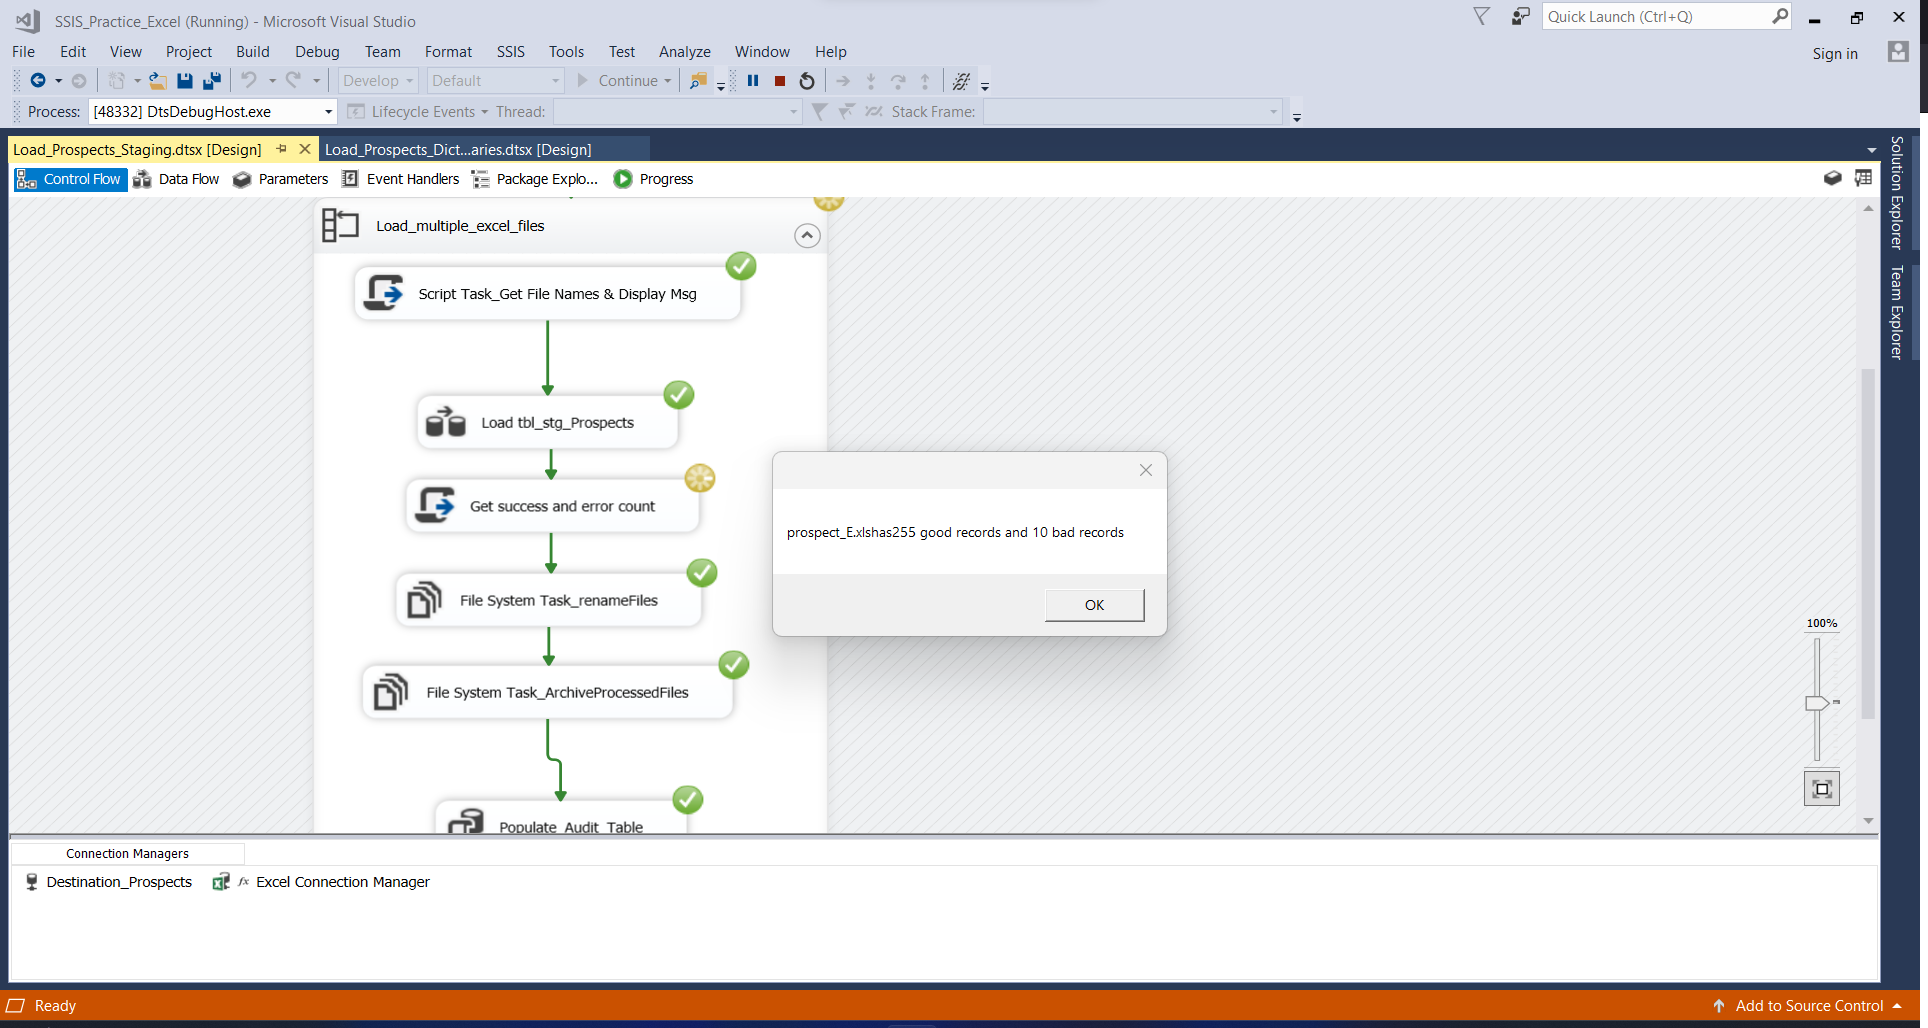
Developing packages on Microsoft Visual studio is one of the tools used for Data Adquisition and Preparation. It allows you to extract, transform and load data. These pics show the hard work in the background. It implies cleaning data by removing missing and incomplete values, converting data to different data types and creating new features for data profiling, auditing and error handling. Sample packages are going to be available in my Github repository.
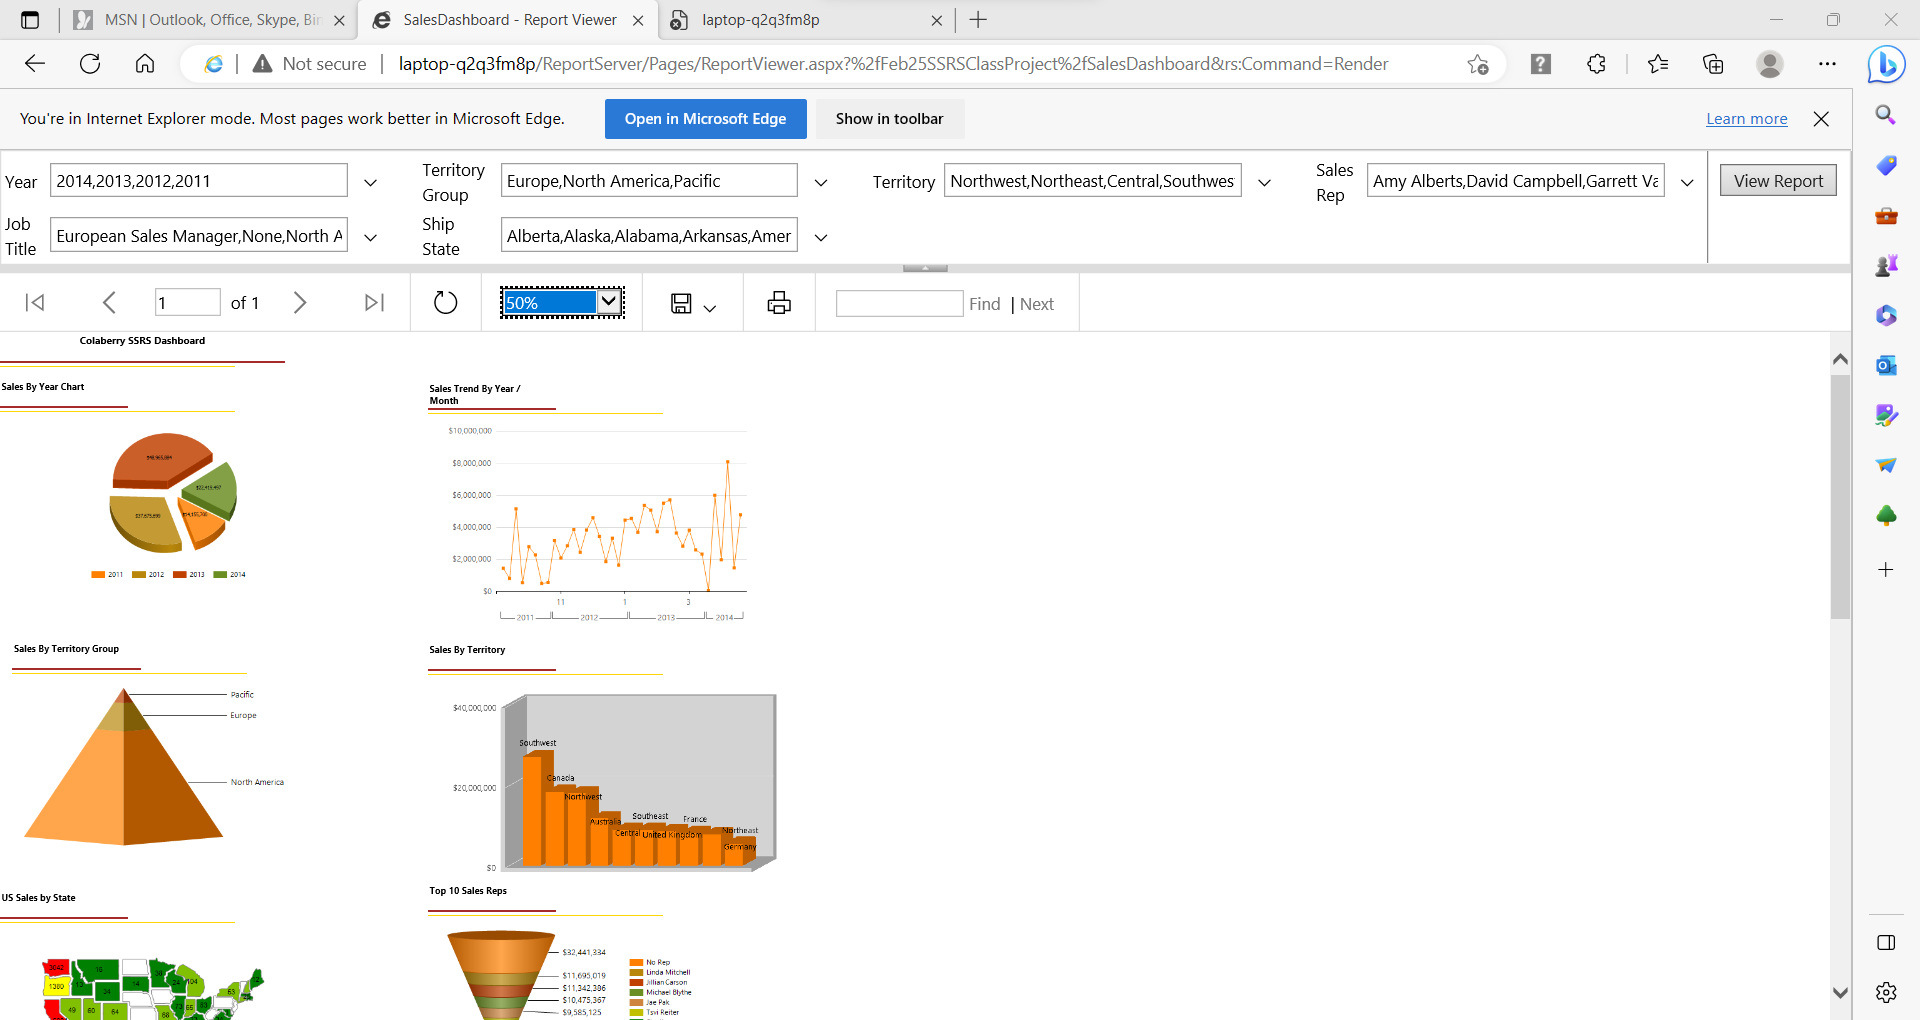
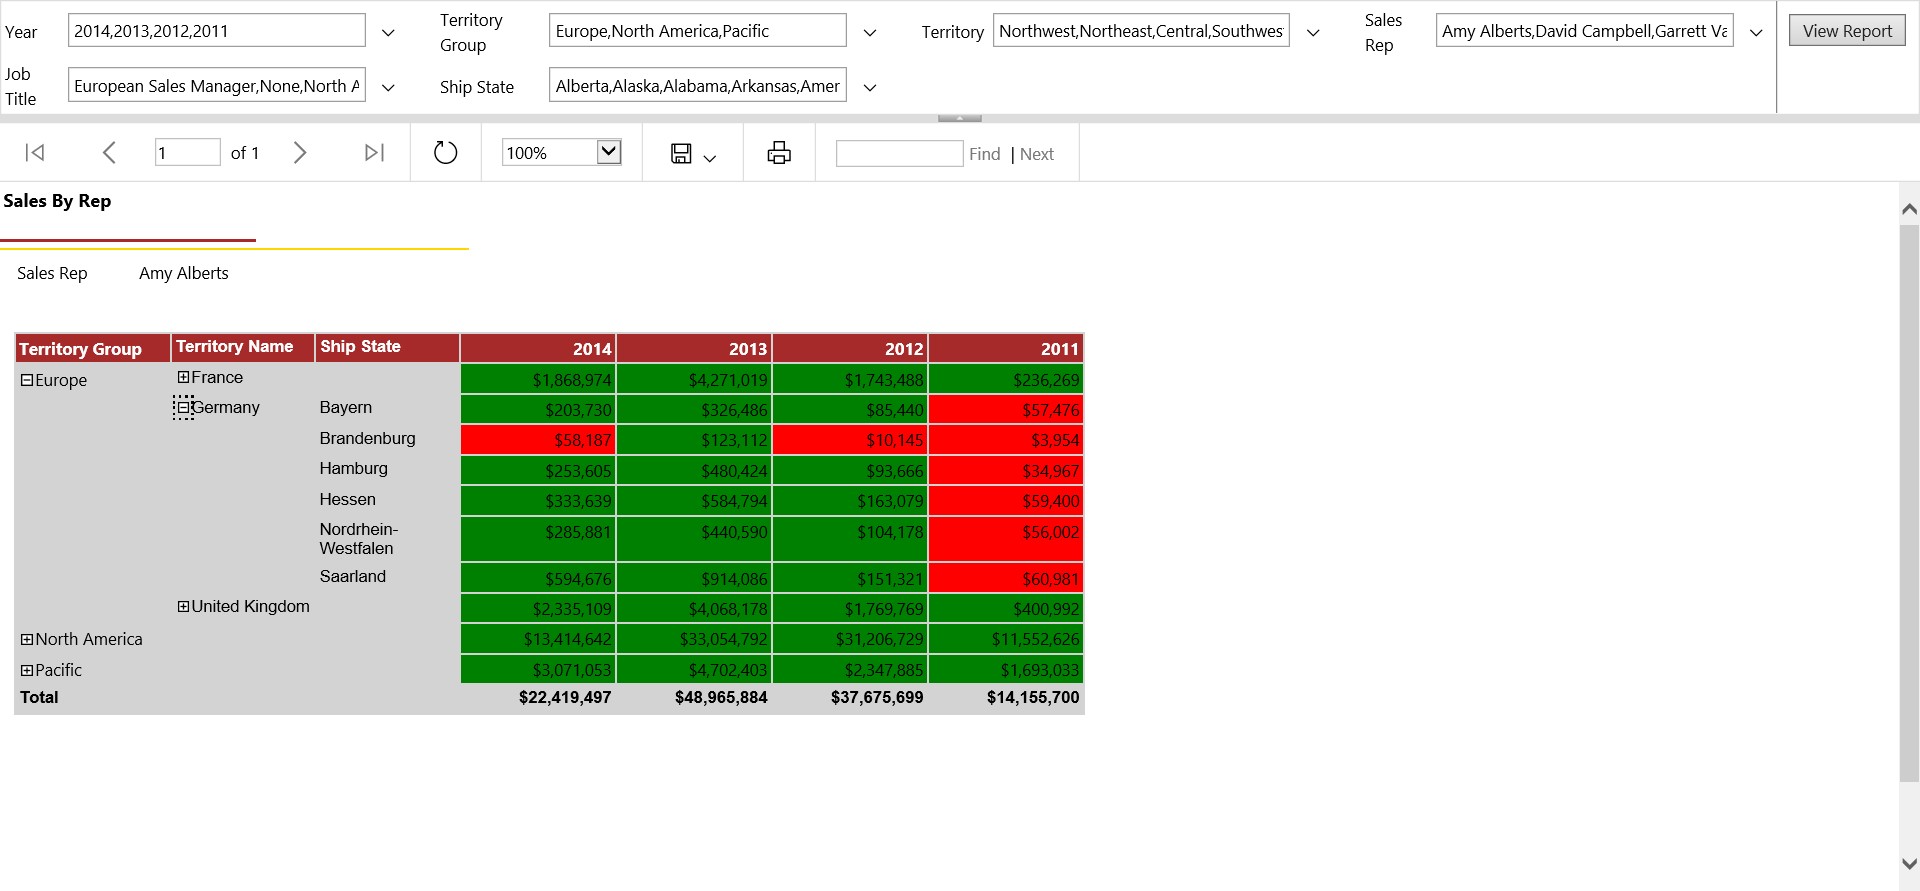
I also have skills to visualize data using SQL Server Reporting Services to create charts and graphs, tables, matrices and drilldowns, parameterization, sub reports, drillthrough, report manager and report automation.
By clicking on my Github link, you will be able to obtain files of my SQL coding in .sql format. These files will demonstrate my progression of learning new skills to developing advanced Queries.